



Your Cart is Empty
A clearer way to use this tool
The comparison answers one narrow question: how much of a food supplies the same number of protein grams? It does not claim that the foods are nutritionally identical, interchangeable in every meal, or equally suitable for your needs. Calories, fiber, fats, vitamins, preparation, and enjoyment remain part of the bigger picture.
Choose the Protein Amount You Want to Compare
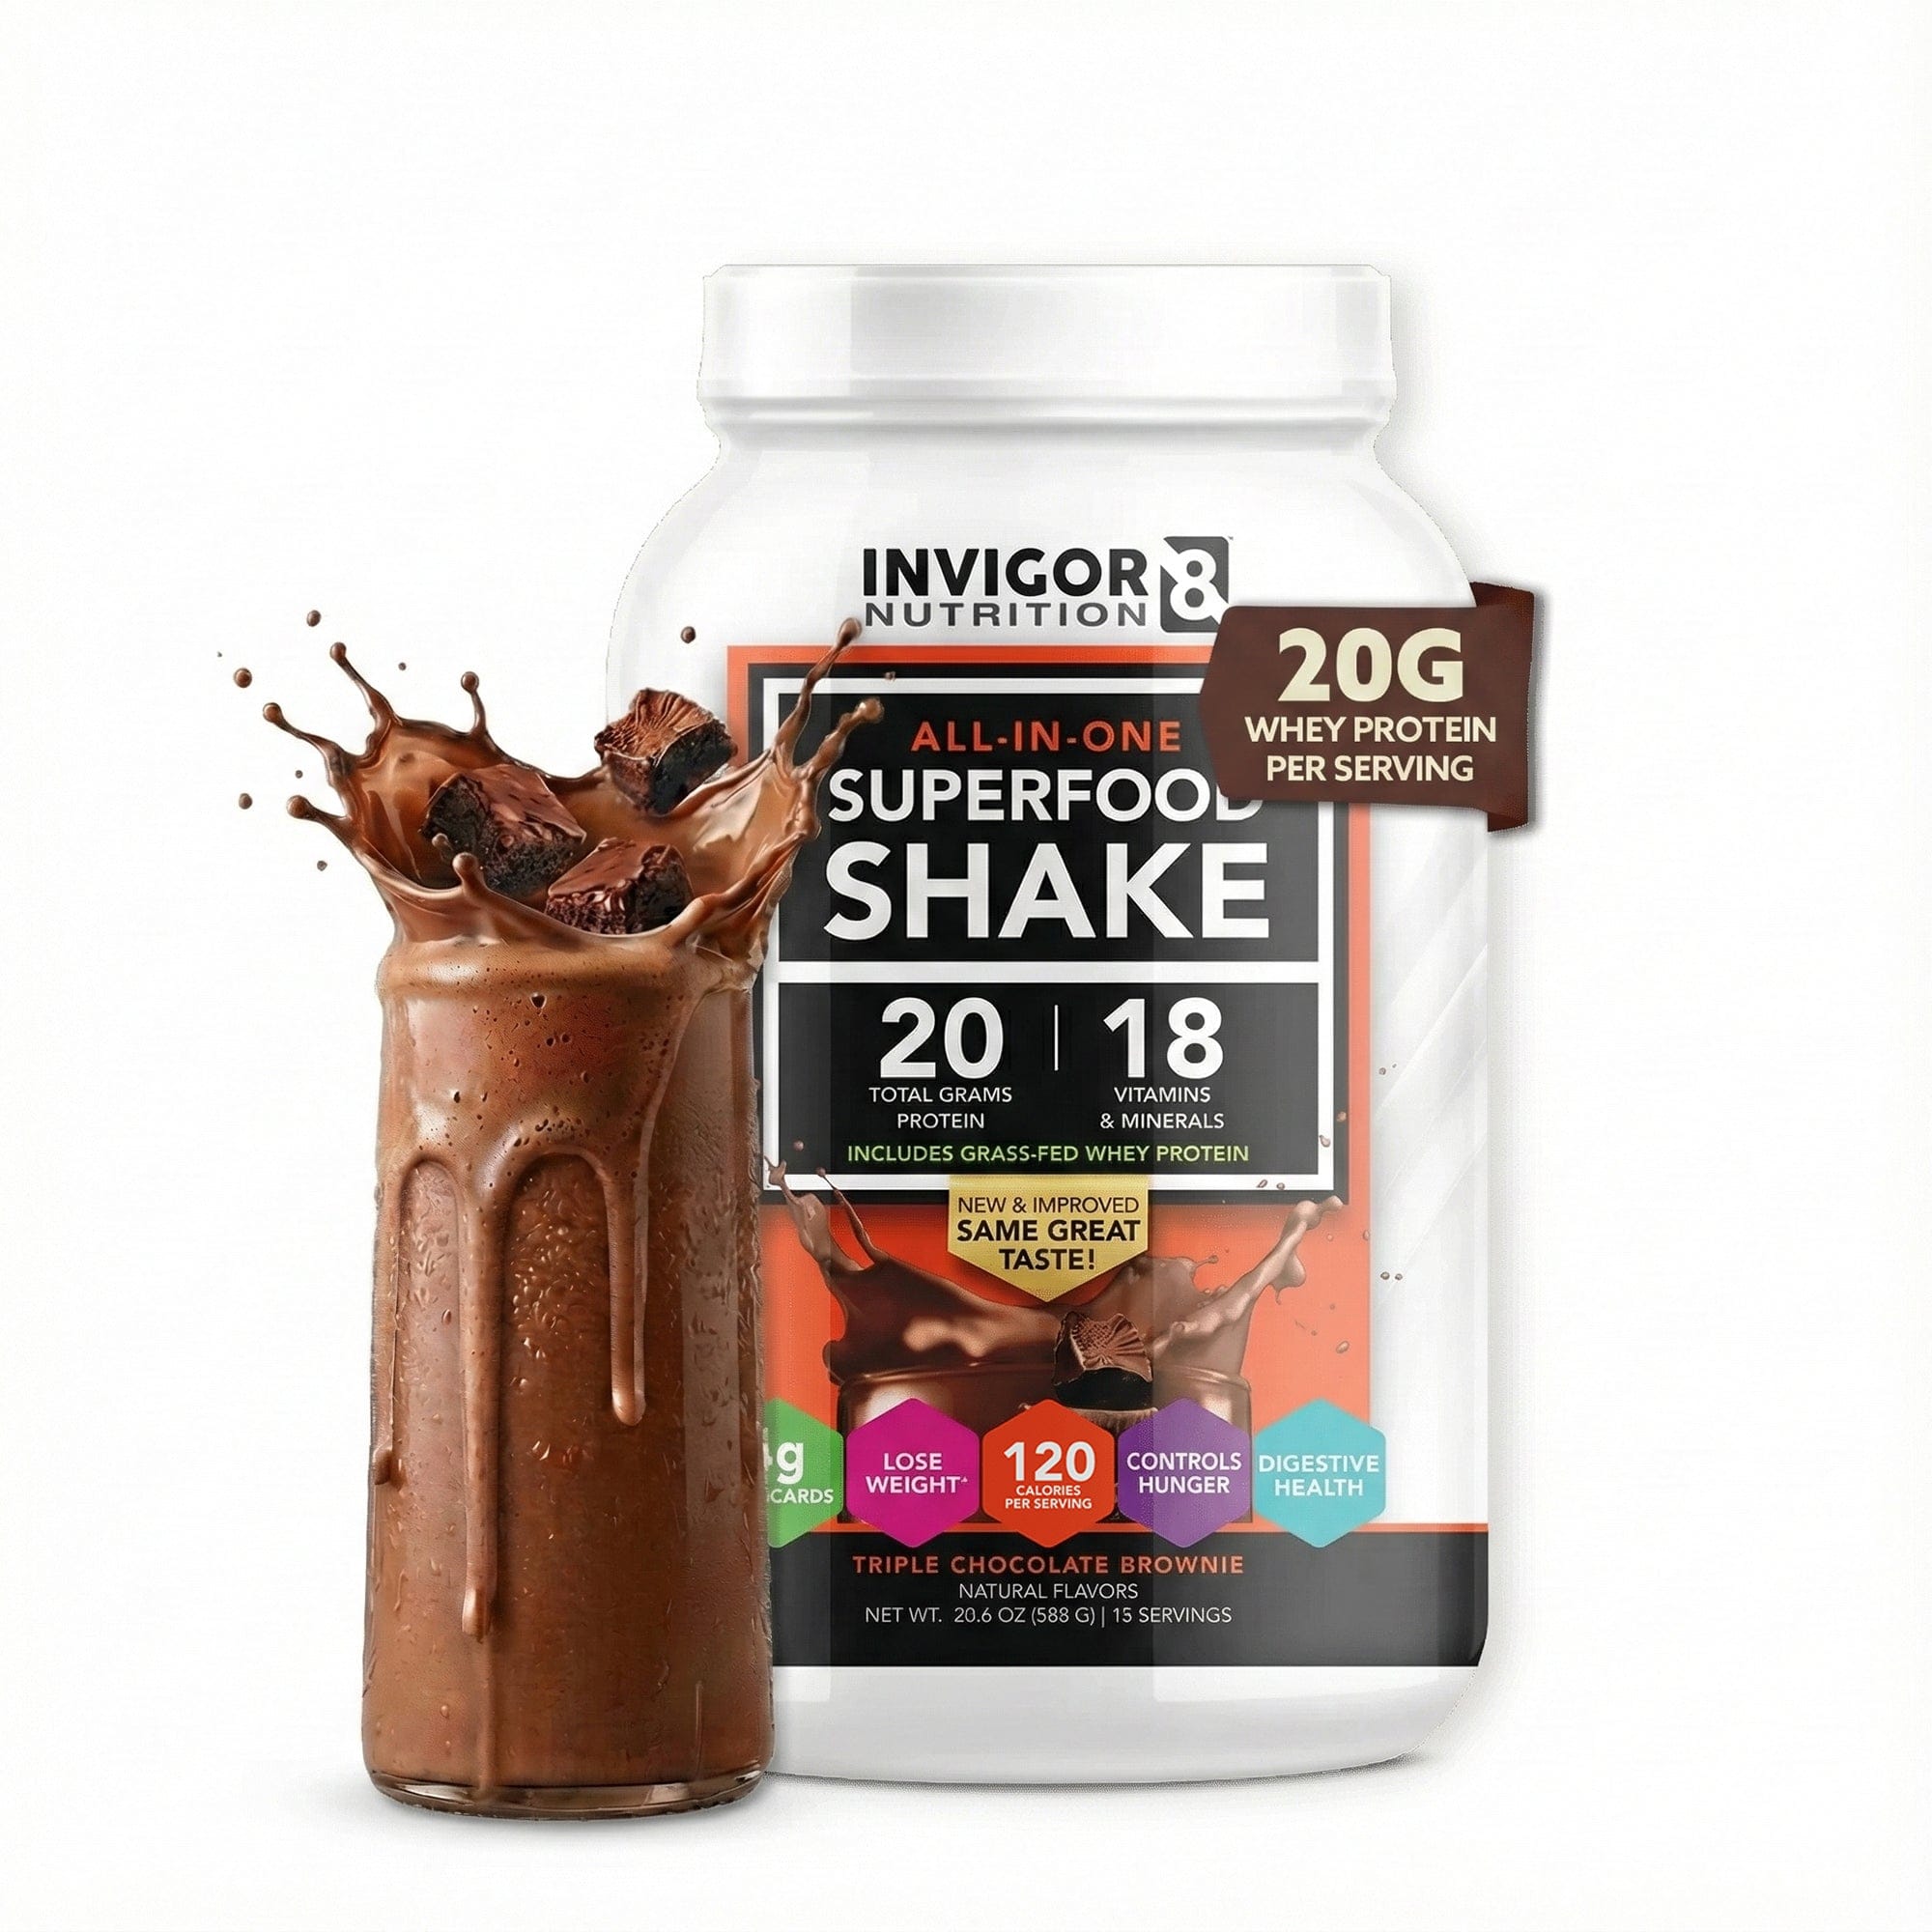
Start with an INVIGOR8 serving fraction or enter a custom protein amount. A full labeled two-scoop serving supplies 20 grams of protein on the reviewed labels. Half a serving supplies 10 grams. The chart scales the food equivalents to the amount you select. [1]
You might compare a single shake serving, the protein in a recipe, or a number from a food label. The chart does not decide your daily target. Use the separate protein intake calculator if you want to explore a general reference or a target you have already been given.
Keep the reason for the comparison simple. You may want to picture a label number, plan a shopping quantity, or understand how food portions differ. None of those tasks requires treating the result as an instruction to eat every displayed equivalent.
How the Equivalence Calculation Works
The chart divides your selected protein amount by the protein in a food's stated portion. It multiplies that ratio by the portion size. The result shows approximately how much of that food would provide the same protein amount under the entered assumptions.
For an illustrative food with 10 grams of protein per 100 grams, matching 20 grams of protein requires 200 grams of food. If another food supplies 20 grams per 100 grams, matching the same amount requires 100 grams. These examples explain the formula without claiming that the two foods are nutritionally identical.
The equation is available beside each result. That makes the chart easy to check and lets you replace the starting food value when your package differs. A useful comparison should make its assumptions visible instead of hiding them behind a confident serving image.
Use Food Values That Match Your Portion
The starter chart includes approximate examples for common foods. Those values help make protein amounts easier to picture, but the actual food, brand, preparation, and portion can differ. Check your package or a suitable food database when you want a closer estimate. [2]
Do not mix a protein value per 100 grams with a portion described as one cup unless you also know the weight of that cup. The unit basis belongs to the number. The custom food entry asks for both so the result stays understandable.
You can edit the protein value in an existing example or add another food. Give it a clear name and portion description. A label-based entry such as your usual yogurt is often more useful for daily planning than a generic category that covers many different products.
Compare Eggs Without Turning Fractions Into Instructions
Egg size and preparation can affect a food estimate. The chart uses an editable example value for one large egg and reports a fractional equivalent when appropriate. A result such as approximately three eggs is a way to picture the protein amount, not an instruction to use that portion in every situation.
If you normally eat eggs as part of a meal, consider the rest of that meal too. Bread, vegetables, cooking fats, and other ingredients can change the overall nutrition and practical role. The protein equivalent deliberately leaves those additional questions separate.
When a fractional result is awkward, use it as a rough visual reference. You do not need to measure a fraction of an egg to make the tool useful. The comparison explains a nutrition number; your meal can remain an ordinary meal.
Milk and Yogurt Need Product Details
Milk and yogurt categories include many products with different nutrition profiles. A cup of one drink may not provide the same protein as a cup of another. Strained yogurt, sweetened yogurt, and plant-based alternatives also differ.
Use your actual label if one is available. Enter the protein and the associated portion, then let the chart scale it. This is especially helpful when a generic example is far from the product you buy regularly.
The result should not be interpreted as a recommendation to drink a large volume merely to match a shake. It gives a numerical comparison that you can put alongside preferences, practical portions, dietary requirements, and the food's wider nutrition profile.
Distinguish Raw and Cooked Food Weights
Preparation changes food weight, particularly through water loss or absorption. A protein value expressed for cooked chicken should not be applied automatically to the same weight of raw chicken. Likewise, dry beans and cooked beans need different reference values.
The food cards name the preparation basis used in the example. Keep that description if you edit a value, or rename the card when you switch to a different preparation. Small details in the name prevent large misunderstandings in the portion result.
If you are planning shopping quantities, remember that a cooked serving equivalent does not directly tell you the raw amount to buy. That is a separate kitchen-yield calculation. The chart stays focused on the stated food portion instead of inventing an unverified conversion.
Plant Foods Deserve a Clear Comparison Basis
Beans and tofu can appear in the chart beside animal foods because the selected comparison is protein grams. That common measure does not erase differences in fiber, texture, other nutrients, or the range of foods that make up your diet.
Tofu products vary in firmness, water content, and nutrition. Beans vary by type and preparation. Use a label or a reference that describes the food you mean rather than assuming all plant proteins share one number.
The chart is useful when it helps you see those differences more clearly. It should not turn a category into a winner or suggest that one source replaces every other food. You can use different foods for different meals and still find the numerical comparison informative.
Equal Protein Is Only One Dimension
Two portions with similar protein can differ in energy, carbohydrate, fat, fiber, sodium, micronutrients, and preparation. A chart focused on protein should say that plainly rather than implying a complete food replacement comparison.
This also applies to convenience. A shake may be quick to prepare, while a food portion might be part of a meal you already enjoy. The most practical choice can depend on the setting, not just the grams or the size of the equivalent portion.
Use the result to describe a specific difference. You can say that a stated amount of a food provides approximately the same protein as your selected serving. Avoid extending that statement into a claim that the options have the same overall effect on health or appetite.
Where INVIGOR8 Fits Alongside Food
INVIGOR8 Superfood Shake can be considered as a convenient protein option when its ingredients and preparation fit your needs. The chart makes its labeled protein easier to picture beside foods, without suggesting that a shake should replace the variety in your diet.
Open the current product label if you want to review the full serving. The protein amount is one part of that information. If you mix the powder with milk, yogurt, or other ingredients, use the shake builder to calculate the finished recipe before comparing its protein here.
The two tools work together because they answer different questions. The builder tells you what your drink contains under your chosen inputs. The equivalents chart helps you visualize one of those numbers using stated food portions.
Make the Chart Useful for Shopping and Meal Planning
Choose a few foods you actually use rather than browsing every possible equivalent. Update their values from your own labels and compare portions that make sense in your kitchen. The chart becomes more useful when the examples reflect your routine.
You can print the comparison and keep the portion notes. That makes it easier to remember whether a value referred to cooked food, a particular yogurt, or a labeled serving of powder. Without those details, a protein number can lose its meaning quickly.
Use the printed chart as a reference, not a rigid meal plan. If a suggested numerical equivalent looks impractical, combine foods or choose another option that suits your routine. A useful comparison helps you understand choices while leaving room for ordinary food preferences.
Know When You Need a Different Tool
If your question is how much protein to eat daily, start with the intake calculator and appropriate personal guidance. If your question is the calories in a smoothie, use the recipe builder. If you need exact nutrient planning for a medical condition, work with a qualified professional.
The equivalents chart does not evaluate allergies, diagnose inadequate intake, or decide whether a particular food is appropriate for someone else. Those questions require information beyond a protein label and a portion size.
Keep the task narrow and the result becomes more useful. Select a protein amount, check the food assumptions, and explore the portions. You will leave with a clearer picture of the number rather than a claim that any one food or shake is the answer to every nutrition goal.
A few more answers
Frequently asked questions
What is a protein equivalent?
Here it means a stated food portion supplying approximately the same protein grams as the amount you select. It does not mean the foods have identical calories, nutrients, preparation, or suitability. The chart compares one dimension and keeps the portion basis visible.
How much food equals one INVIGOR8 serving?
That depends on the food and its protein value. A reviewed full serving provides 20 grams of protein. The chart divides that amount by each example's protein concentration to calculate a portion. Edit the food data when your package differs from the example.
Are the food values exact?
No. The starter values are approximate examples and may differ from your food or brand. Use an actual label or suitable database entry when greater precision is important. Keep the preparation and portion description with any value you enter.
Can I add my own food?
Yes. Enter its name, protein per stated portion, portion size, and unit. The chart then calculates a matching amount for your selected protein target. Choose compatible units and avoid treating missing portion information as something the tool can infer.
Does equal protein mean equal calories?
No. Foods with similar protein can have different amounts of carbohydrate, fat, fiber, and energy. The chart deliberately avoids claiming a complete nutritional equivalence. Use additional label information when comparing the broader role of the foods in a meal.
Can I compare a whole smoothie?
Yes. First calculate the smoothie's protein using the shake builder or your own recipe labels. Then enter that amount as a custom protein target here. The food equivalents describe that protein amount, not the rest of the smoothie nutrition.
Is this a replacement for a meal plan?
No. It is a portion comparison tool. A complete food plan considers more than protein and may require individualized guidance. Use the chart to understand labels and ask clearer questions, while keeping your broader diet and personal requirements in view.
Sources and reference notes
[1] INVIGOR8 labeled protein per serving ↗[2] USDA FoodData Central for checking your own food references ↗Product label images reviewed October 20, 2026. Generic food and recipe presets are illustrative, editable estimates. Check current package information and official travel rules. No personal health information is saved by these tools.
For educational planning only. Consult a qualified healthcare professional for individualized nutrition needs. The tools do not diagnose, treat, cure, or prevent disease. These statements have not been evaluated by the Food and Drug Administration.